This amount of heat energy is unlikely to have no effect on global warming.
More concrete signals that the development of a solar power plant infrastructure could lead to climate disruption and rising temperatures.
-
Urban Heat Island effect (UHI)
The UHI is a real phenomenon.
The paper "The Effect of Urban Heat Island on Climate Warming in the Yangtze River Delta Urban Agglomeration in China" presents the effect of UHI on climate warming based on an analysis of the effects of urbanization rate, urban population and land use change on the warming rate of mean, minimum (night) and maximum (day) air temperature in the Yangtze River Delta (YRD) using observational data from 41 meteorological stations. In conclusion, the authors found that observations of daily mean, minimum, and maximum air temperature atmeasurement stations in the YRDUA from 1957 to 2010 showed significant long-term warming due to background warming and UHI. The warming rate of 0.108 to 0.483°C/decade for mean air temperature is generally consistent with the warming trend in other urban regions in China and other urban areas in the world.
Thus, the authors showed that urbanization significantly enhanced local climate warming.
The solar power plants based on photovoltaic panels are even hotter islands of heat than highly urbanized agglomerations. During the period of most intense sunlight, the temperature near a solar power plant can be up to 3 degrees Celsius higher than the temperature in a similar environment without solar panels and similar solar conditions.
Suggestion:
The similarity in heat generation between the two cases - densely populated metropolitan areas and solar power plants - suggests the same effect - warming the air over a larger area.
-
Correlation between Urban Heat Island (UHI) effect and number of heat waves (HW)
Due to lack of access to data, I have to rely on visual comparisons (if anyone knows data to analyze or can make it common, please contact me).
Below I illustrate 2 cases: USA and Europe (Germany in particular).
-
USA case
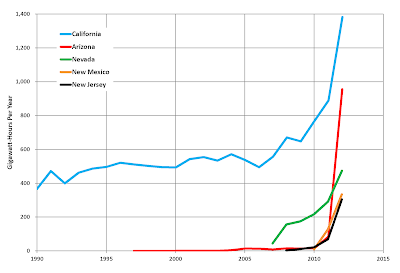
Let's visually compare the 2 images to each other. The first, showing the density of solar power plants in the USA [https://openinframap.org] - Figure 1: The second image, from the paper [U.S. heat wave frequency and length are increasing] showing the increase in the number of HW in the US - Figure 2: Finally, Figure 3: shows the growth of US electricity generation as a function of years (data from https://en.wikipedia.org/wiki/Solar_power_in_the_United_States).As can be seen from Figure 2 (and Figure 3 and Figure 1), the histogram showing the frequency of HW occurrence, the increase in the number of cases from 2000 to 2010 is greater compared to earlier periods.
There is even a geographical correlation (Figure 1 and 2) - which, of course, can also be presented as a fact that power plants are built close to large agglomerations.
In general, the UHI effect should be considered as the sum of the UHI + Solar Heat Island .
I therefore postulate the following hypothesis:
- Until 2000, urban heat islands were mainly responsible for heat waves.
- After 2000, the increase in heat waves can be further attributed to solar power plants.
-
Germany case
How does it look like in Europe ?
The density of solar power plants in Europe [https://openinframap.org] - Figure 4 (below) shows that the largest solar farm infrastructure is in Germany (Let's forget about the UK for a while). Now, numbers of Heat Waves (HW) in Germany:
I was not able to find detailed numbers for heat waves in entire Germany. Instead, from the report Nationaler Klimareport Klima ‒ Gestern, heute und in der Zukunft you can decipher the following number of heat waves counted for 5 major cities in Germany (Hamburg, Dresden, Frankfurt am Main, Mannheim and Muenchen). It shows that (Table 1):
Year period:Nr of Heat weaves:
1950-19605
1960-19704
1970-19805
1980-19903
1990-200017
2000-201015
2010-201919
It shows a huge increase in Heat Waves since the 1990s. Followed by a small stabilization for the periods 1990-2010 and another increase for the last years after 2010. The amount of electricity generated by photovoltaics has been increasing since 2000. And since 2010, there is almost a jump in the growth of solar electricity in Germany (see Figure 5).As can be seen from Table 1 and Figures: 4 and 5, the increase in the number of Heat Waves in Germany after 2000 (after 2010 especially), is correlated with the generated Solar Energy.
-
Conclusions:
Without access to detailed data, it is difficult to conduct a more detailed analysis of the correlation between the number of the HW and the increase in electricity produced by the growing number of solar plants.
However, the suggestion given by the available data presented above is at least worth a closer analysis.
The ideas in the European document
"Fit for in the a Solar Future: Commission climate package is landmark achievement but more ambition is possible"
could prove devastating .
Take care


